Modelling lava flows
As we saw from the previous exercise, lava flows are slightly more complex than water, and the hydrological modelling approach fails to describe some important hazard metrics required for both short- and long-term risk assessments. Assessing the timing of lava inundation is still an active topic of research, so we will restrict ourselves to estimating the surface area of flows. For this, we first need to review some of the physical concepts behind the fluid dynamics of lava flows.
Objectives
- Understand basic rheological properties of lavas.
- Review the main emplacement processes.
- Identify and appreciate the sources of uncertainties in lava flow modelling.
When and why do lavas flow?
Credits
This section is largely inspired by the great rheology class of Tom Shea at the University of Hawai'i.
Some definitions
Shear stress
The shear stress \(\tau\) is the load stress applied to a fluid → i.e., the force per unit area acting in the direction and parallel to the flow surface:
Strain rate
The strain rate \(\epsilon\) is the rate of deformation when a shear stress is applied → i.e., velocity gradient:
Yield strength
The yield strength \(\tau _0\) is the shear stress above which deformation begins:
Viscosity
The viscosity \(\eta\) is the resistance of fluid to flow when shear stress is applied:
When does lava flow?
From Figure 1:
- → Flow occurs when driving forces (here = gravitational forces) > resistive forces
- → Response/behaviour of the fluid depends on its rheology
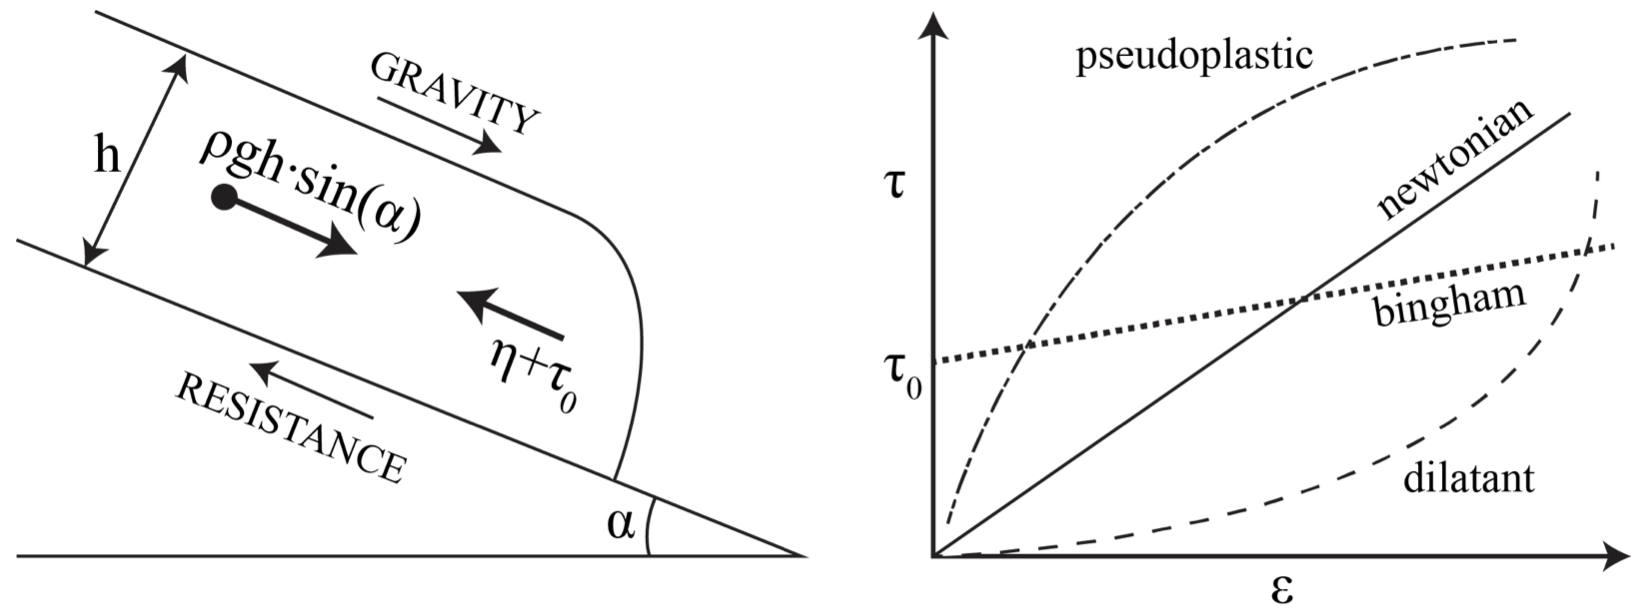
Flow rheology
Newtonian fluids
- Newtonian fluids will start to flow/deform when an infinitesimally low shear stress is applied
- The relationship between the applied force (→shear stress) and rate of deformation (→strain rate) is linear
Non-newtonian fluid
A fluid is non-newtonian when one of these conditions is met:
- The relationship between shear stress and strain rate is non-linear
- A yield strength must be exceeded before flowing occurs, after which the shear stress/strain rate relationship can be linear or not
Amongst non-newtonian fluids:
- Fluids with variable shear stress/strain rate include pseudoplastic or dilatant fluids
- Dilatant fluids: apparent viscosity increases with increasing shear rate → shear thickening fluids
- Pseudoplastic fluids: apparent viscosity decreases with increasing shear rate → shear thinning fluids
- Bingham fluids are a special type of non-newtonian fluids characterized by a yield strength and a linear shear stress/strain rate relationship
Lava flows
Lava flows are typically non-newtonian, pseudoplastic fluids with a yield strength.
Think of a slope. If you drop a newtonian fluid (i.e., no yield strength) on it, it will immediately start flowing, whereas non-newtonian fluids with a yield strength will require some help.
Can you think of any fluids that would behave like these?
Solution
- Water is a newtonian fluid with no yield strength
- Toothpaste is a non-newtonian fluids with a yield strength
What parameters can help lava flows to overcome yield strength?
Solution
- Effusion rate
- Flow thickness
- Slope
Dynamics of lava flows
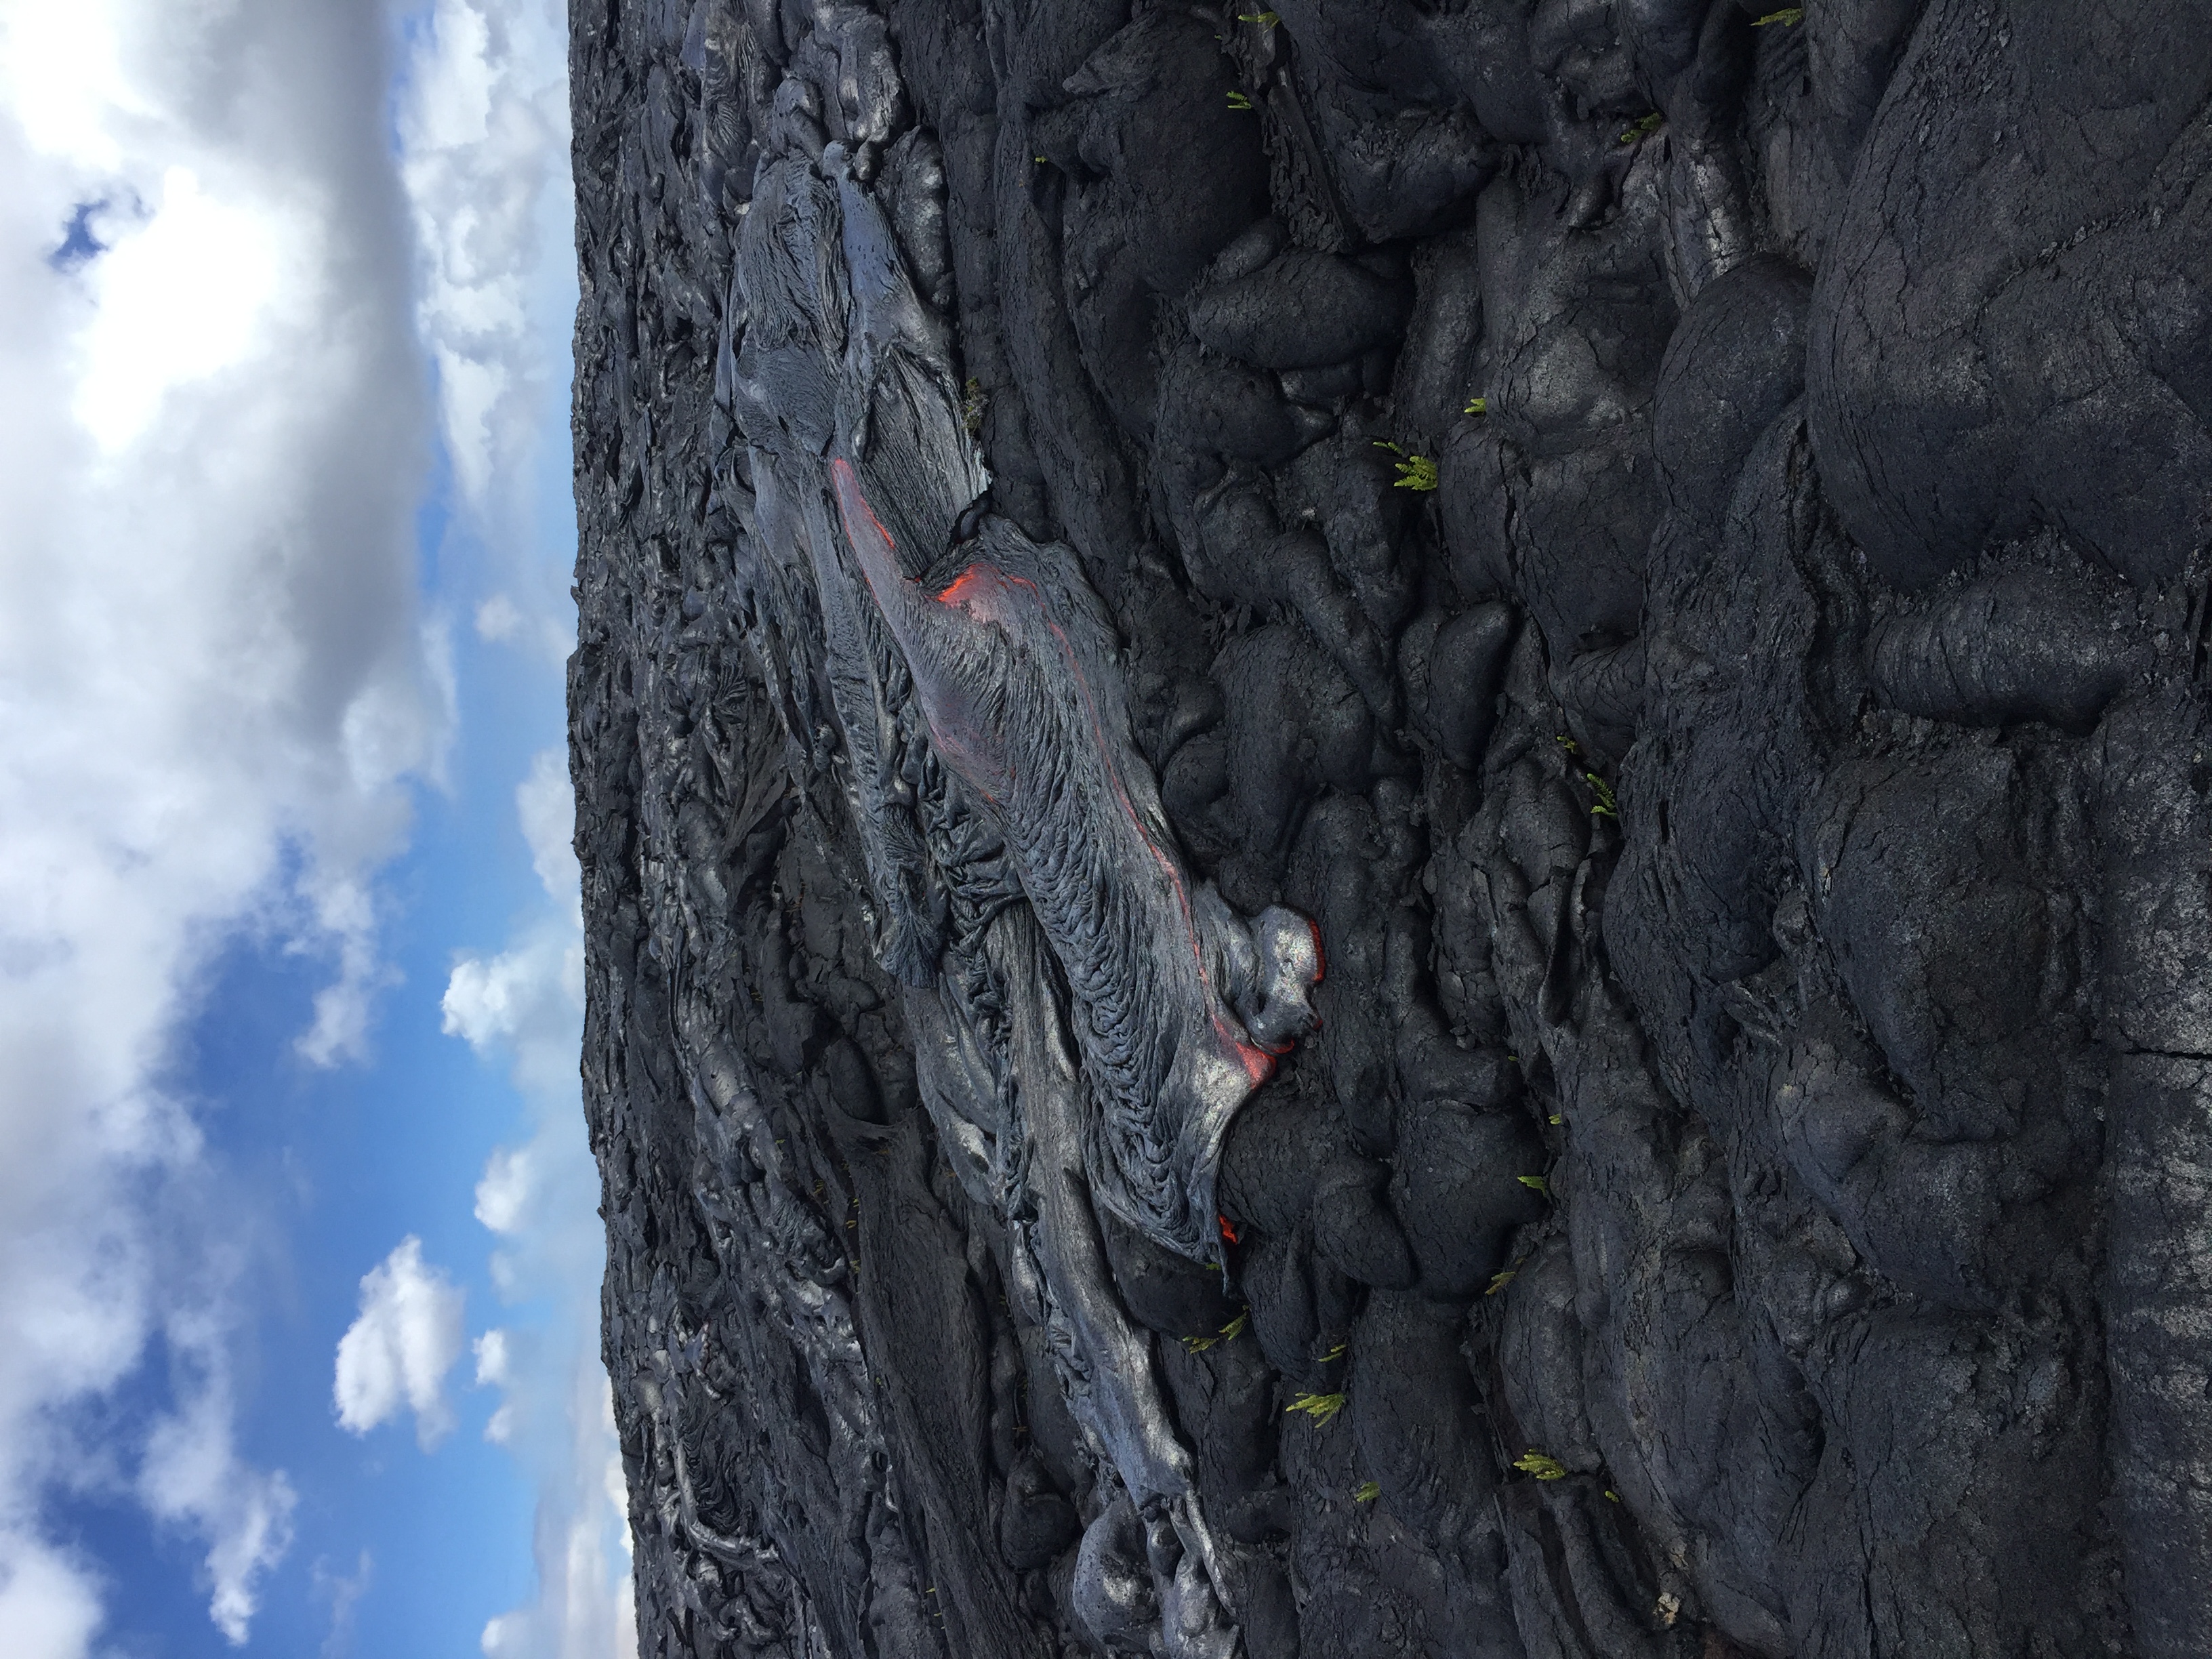
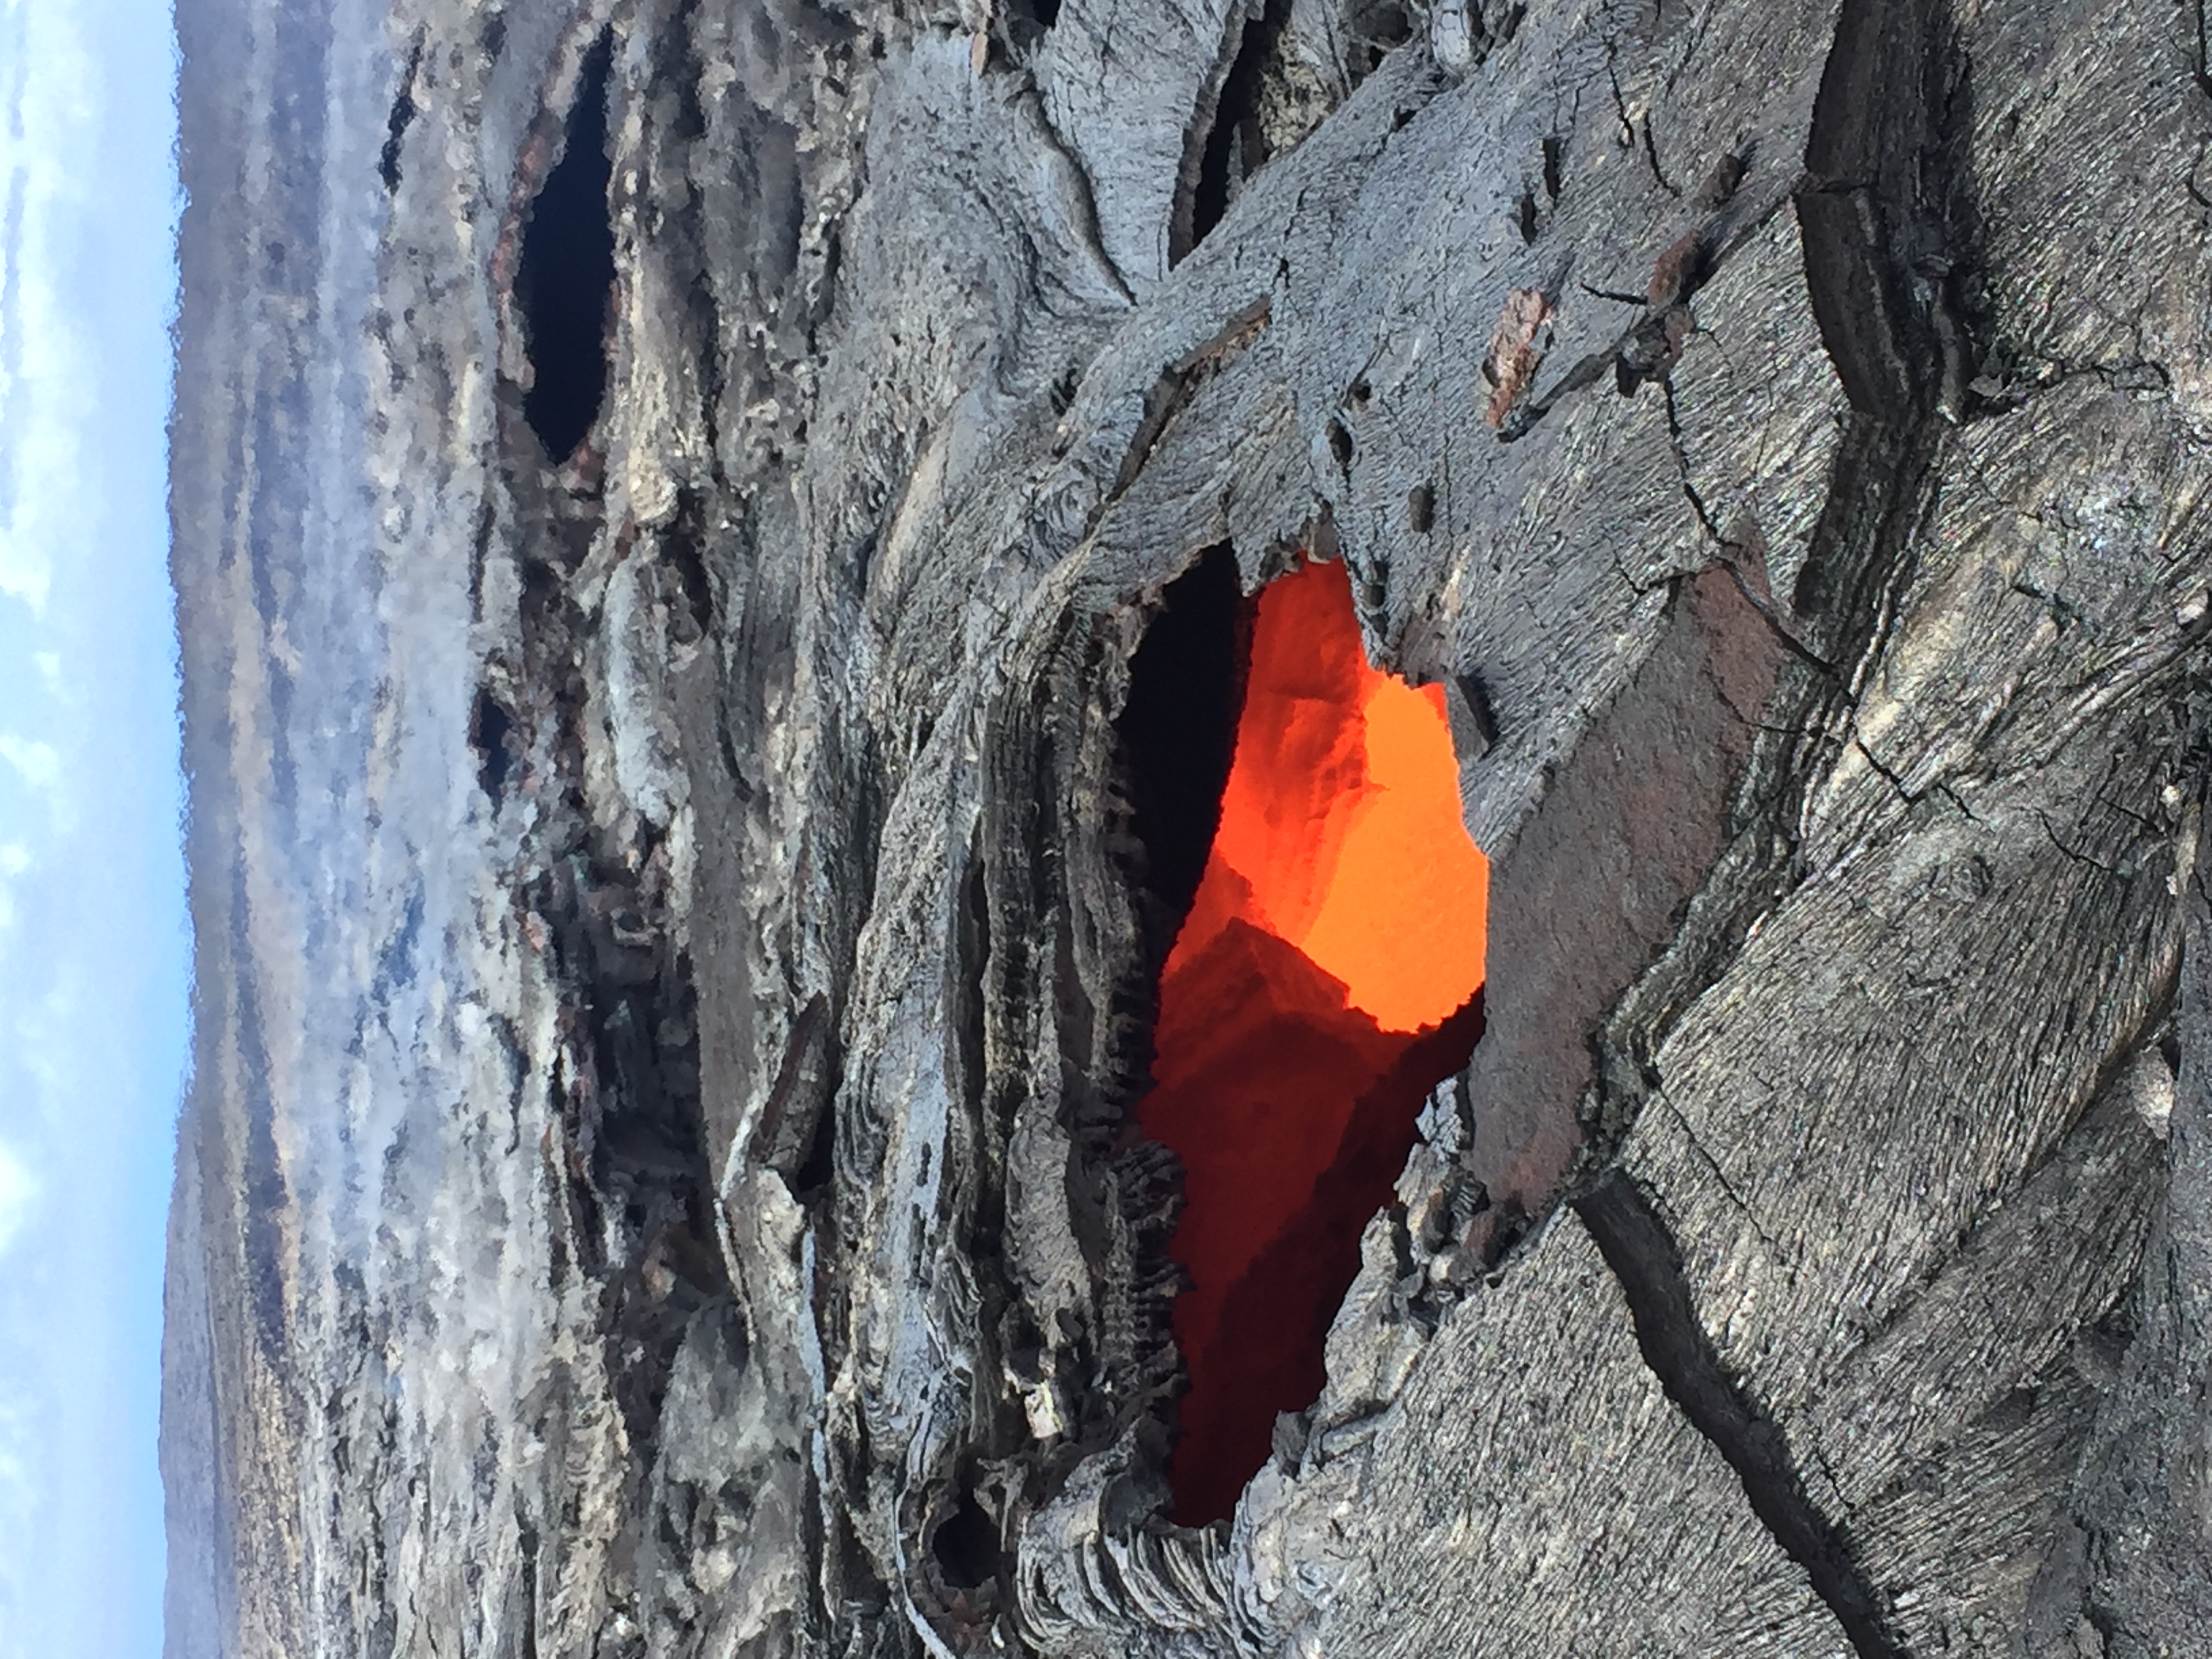
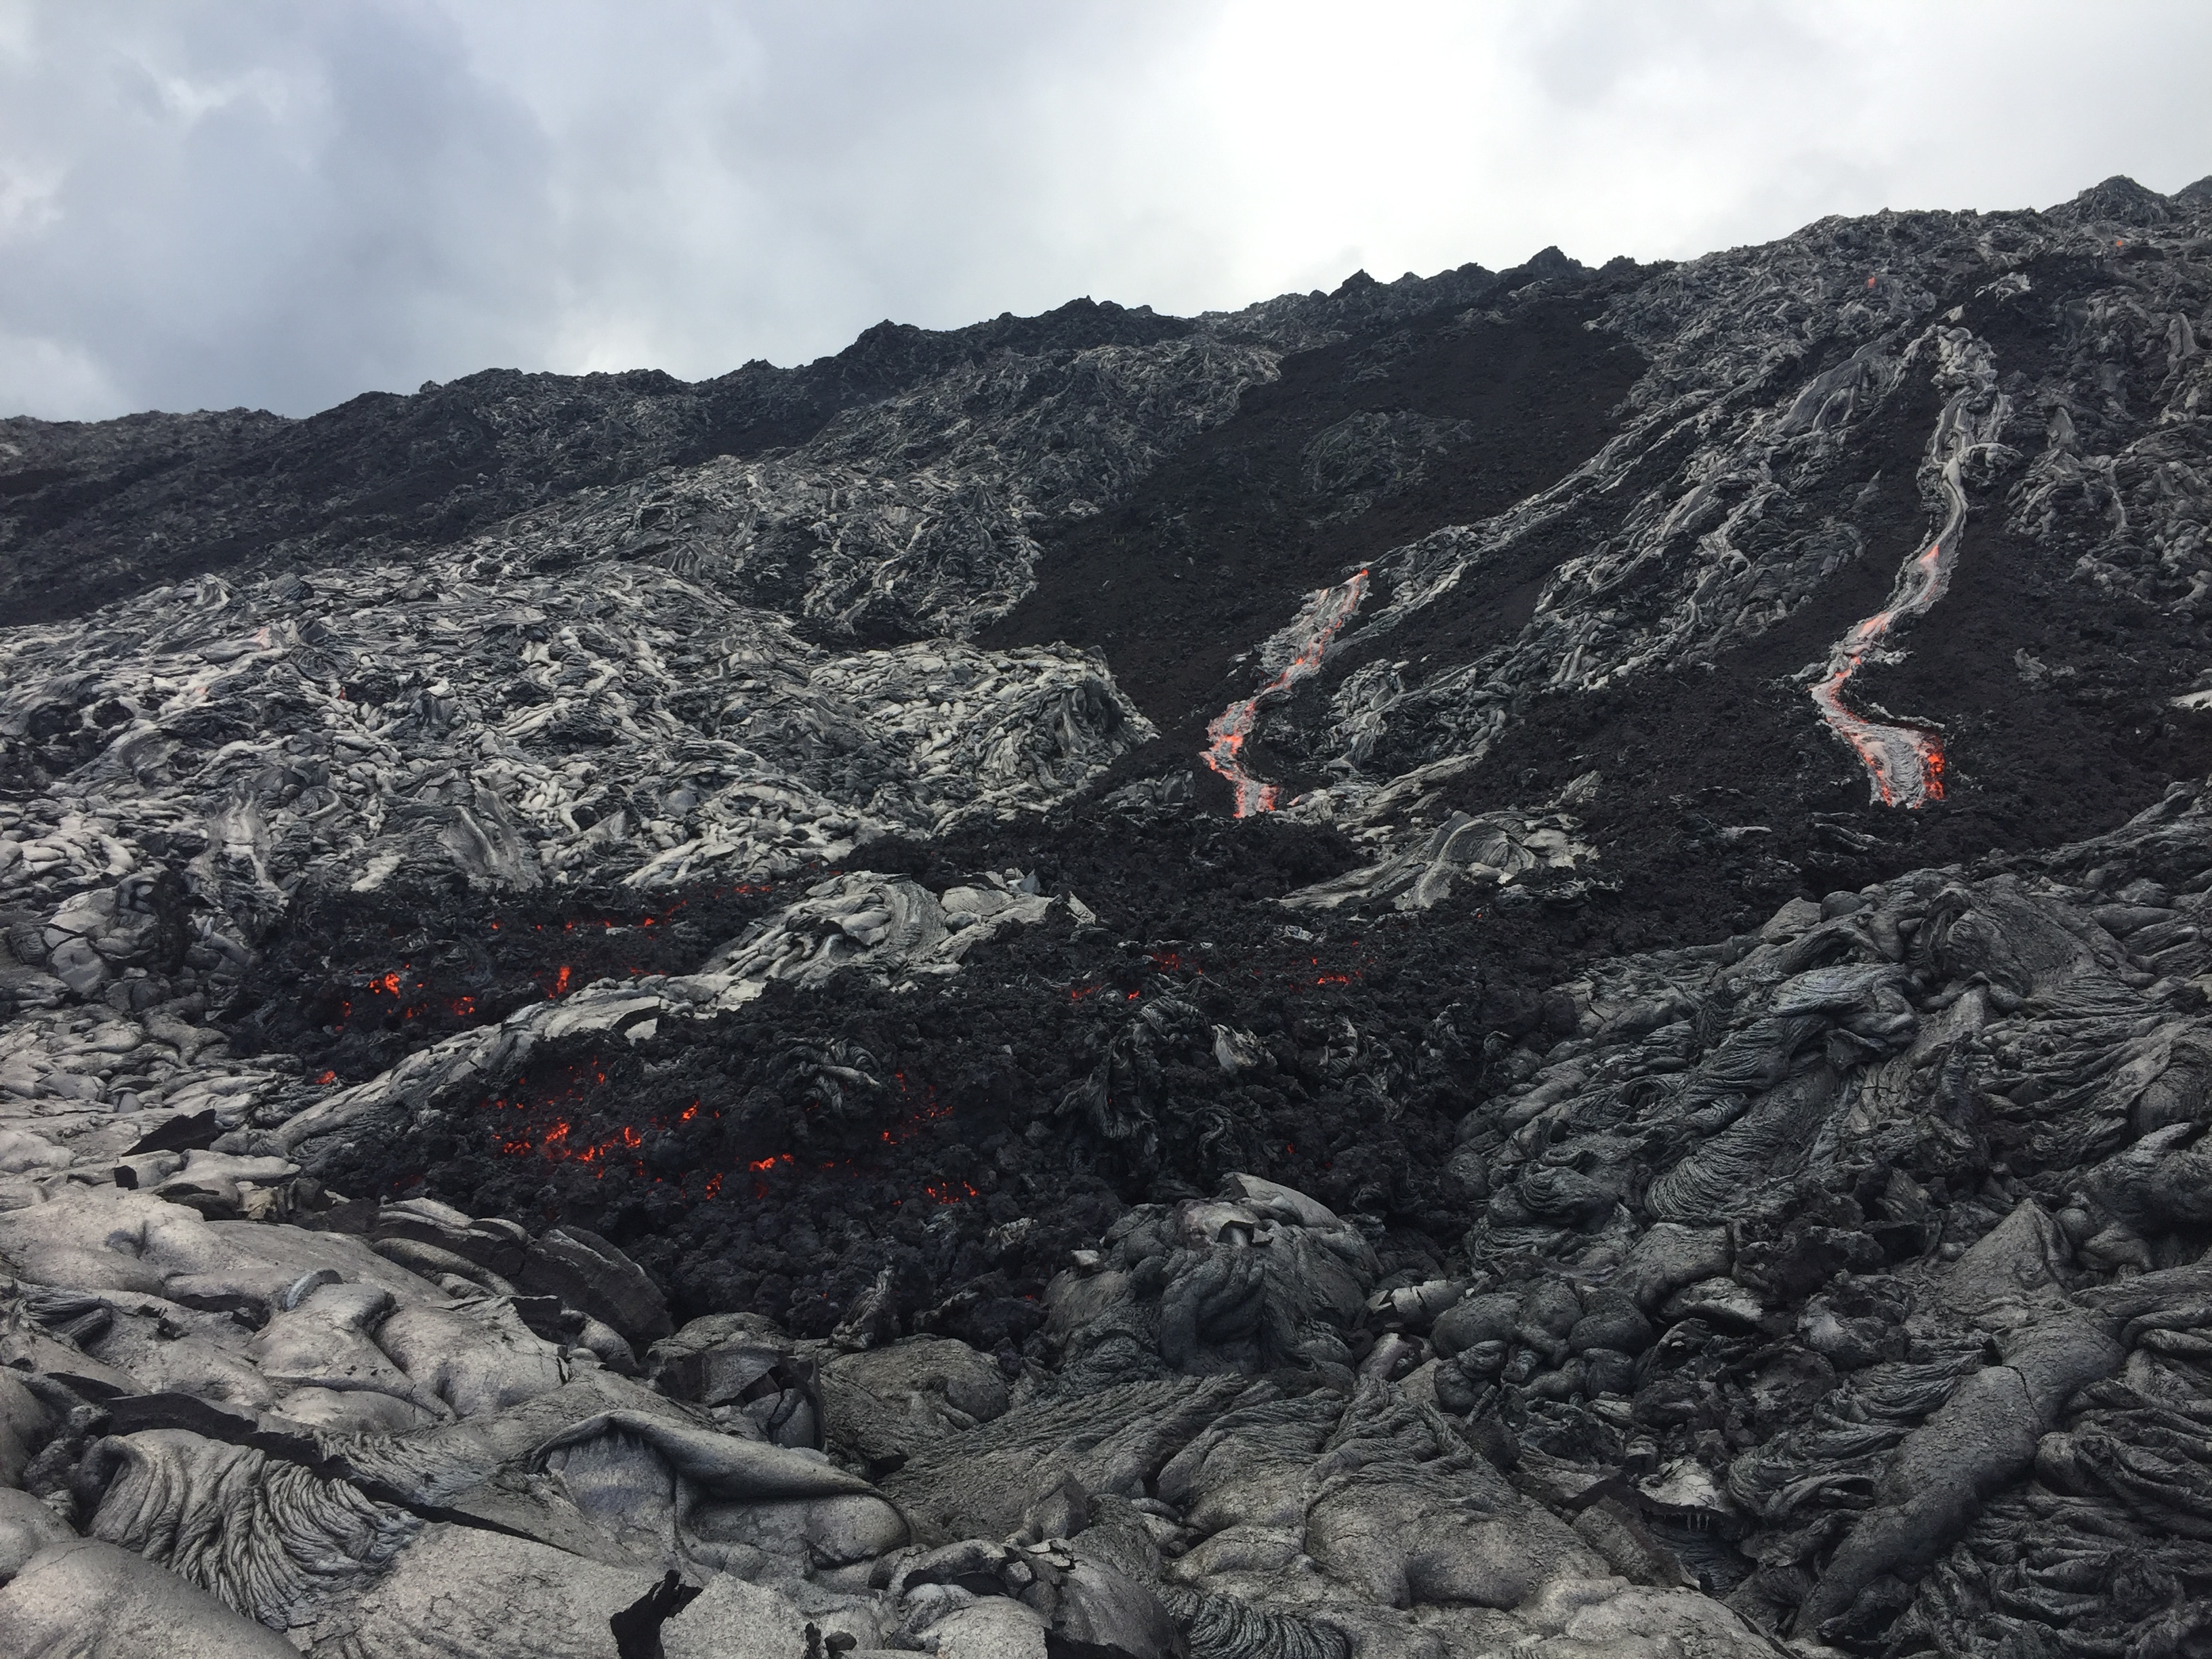
Let's try and put these physical concepts in the perspective of actual lava flows. Look at these videos, and describe them in terms of:
- Flow shape, geometry, morphology, texture
- Colour (as an indicator to which physical parameter?)
- Velocity and flow rate?
| Flow type | Video 1 | Video 2 |
|---|---|---|
| Lava channel | Video 1a | Video 1b |
| Pāhoehoe | Video 2a | Video 2b |
| 'A'ā | Video 3a | Video 3b |
Lava flows properties
What do you see? From the parameters described above, what can you infer on the underlying processes?
- How would you describe the advance rates of each lava flow type?
- What distance from the vent is each flow?
- Where do you think the local effusion rate is the highest?
Physical modelling as a hazard tool
These videos illustrate the variety and the complexity of processes controlling the spatio-temporal evolution of lava flows. Attempting to sum up all processes taking place in lava flow emplacement is difficult, but here are some of the higher-level parameters 1234:
- Advance rate:
- Volumetric effusion rate
- Proximity to the vent
- Flow length:
- Eruption rate (both magnitude and steadiness)
- Slope traversed
- Extent of topographic confinement
- Initial lava temperature and rheological properties
- Emplacement conditions (open channel or insulating tube)
No model is yet able to capture the ensemble of these parameters, and therefore each model relies on different assumptions5. For instance, the FLOWGO model6 describes the physics behind the down-flow evolution of thermal and rheological properties of lava flows, but assumes a channel-contained lava flow. Other models, such as Q-LavHA7 or MrLavaLoba8 bypass the use of physics and describe the emplacement of lava flows as stochastic processes. Understanding both i) the issues behind the studied problem (e.g., process-driven research vs hazard assessment) and ii) the limitations behind numerical models is key to identify and adopt the appropriate modelling approach.
Modeling natural phenomena
Don't forget what the statistician George Box wrote in his 1987 book Empirical Model-Building and Response Surfaces:
Essentially, all models are wrong, but some are useful.
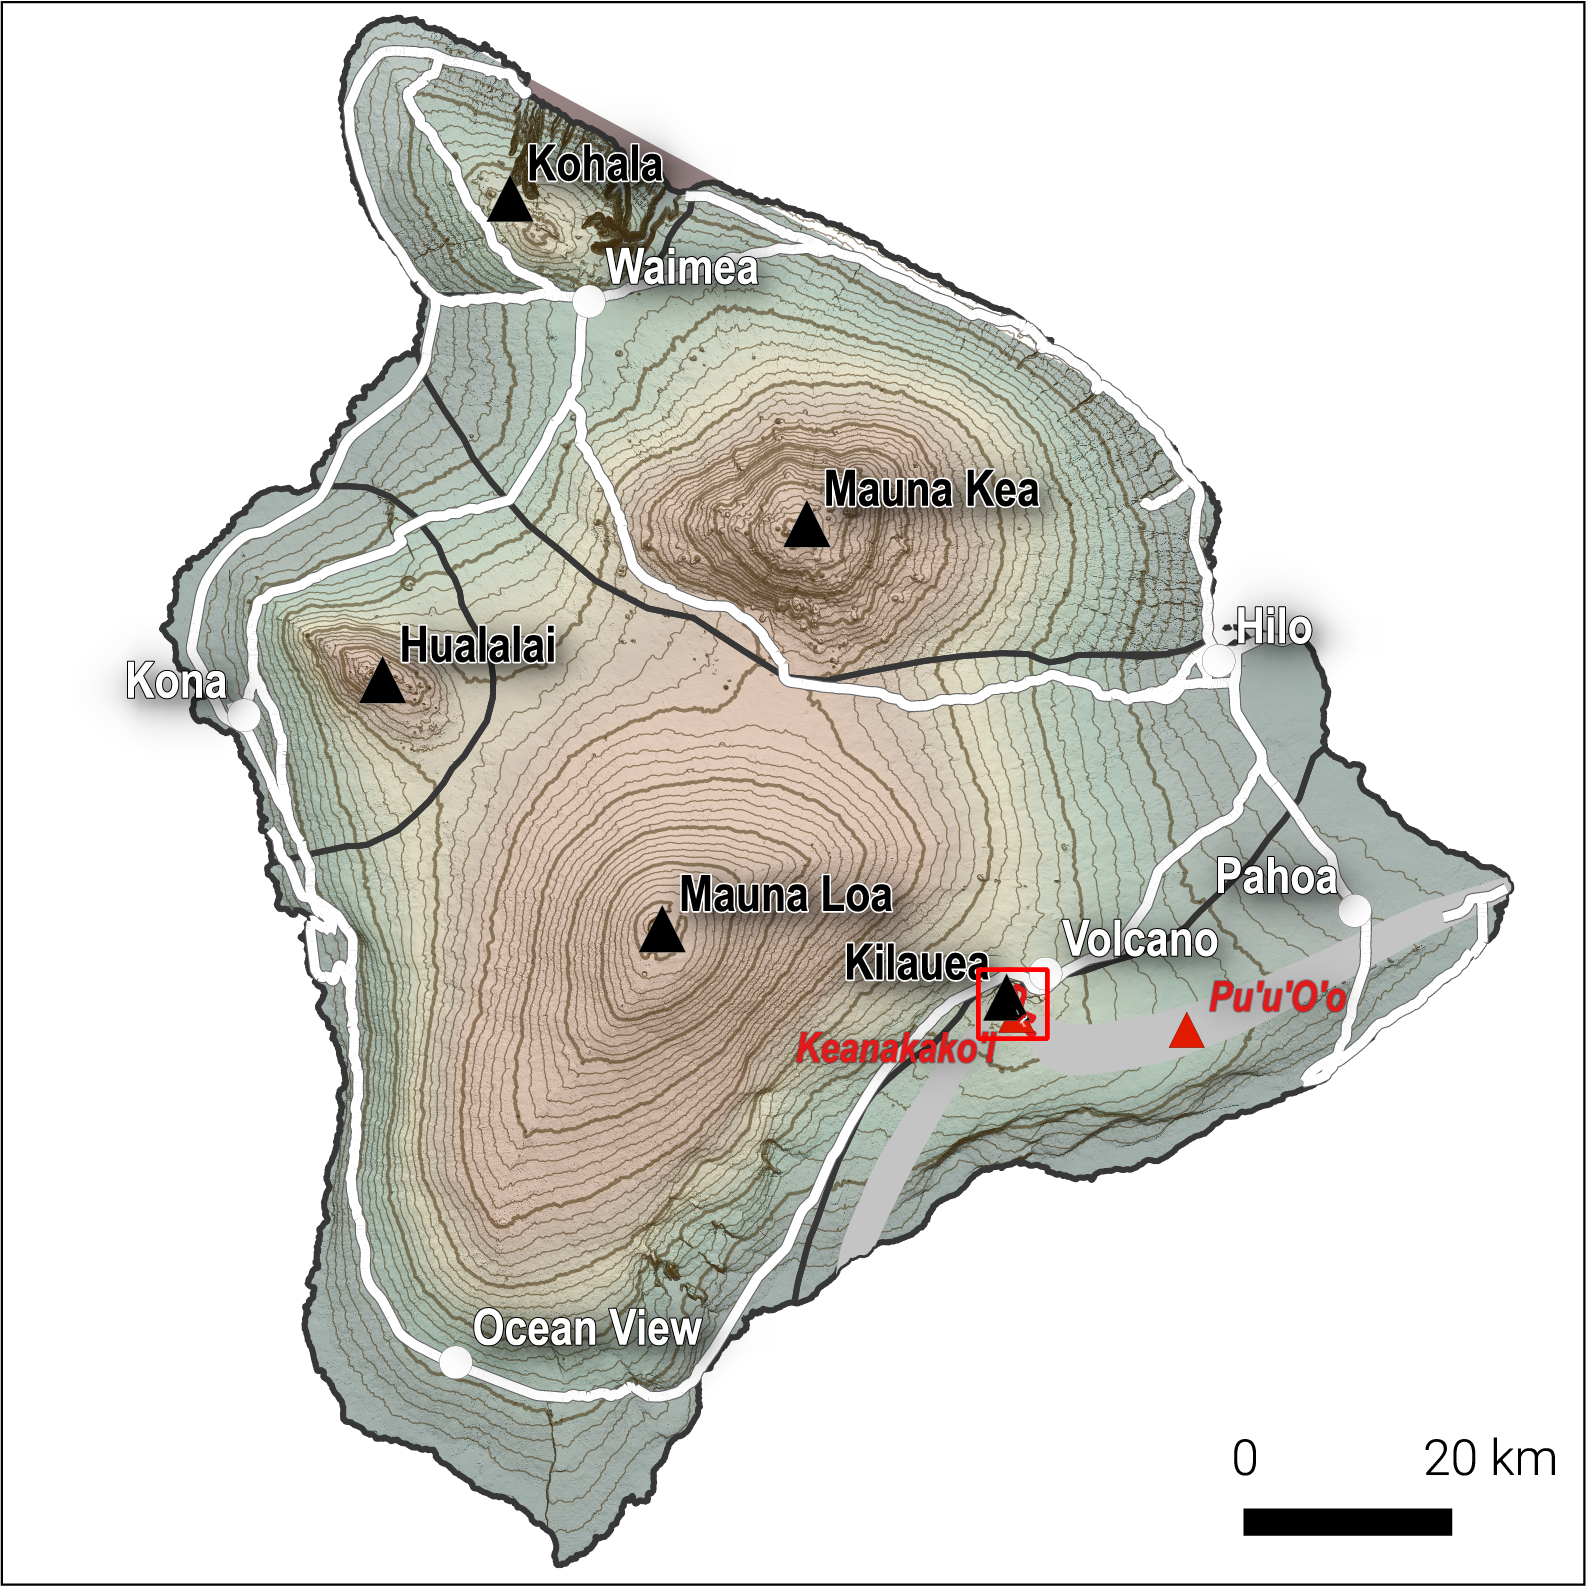
The 2016 eruption of Pu‘u ‘Ō‘ō
As already discussed, the combination of all these parameters make lava flow modeling a complex problem associated with large uncertainties. One critical aspect of risk management is that these lava flow crises are often long-lasting, and predicting their spatio-temporal evolution is currently impossible beyond a time window of a few hours to days. This is especially true for pāhoehoe flow fields, where random processes are important 1.
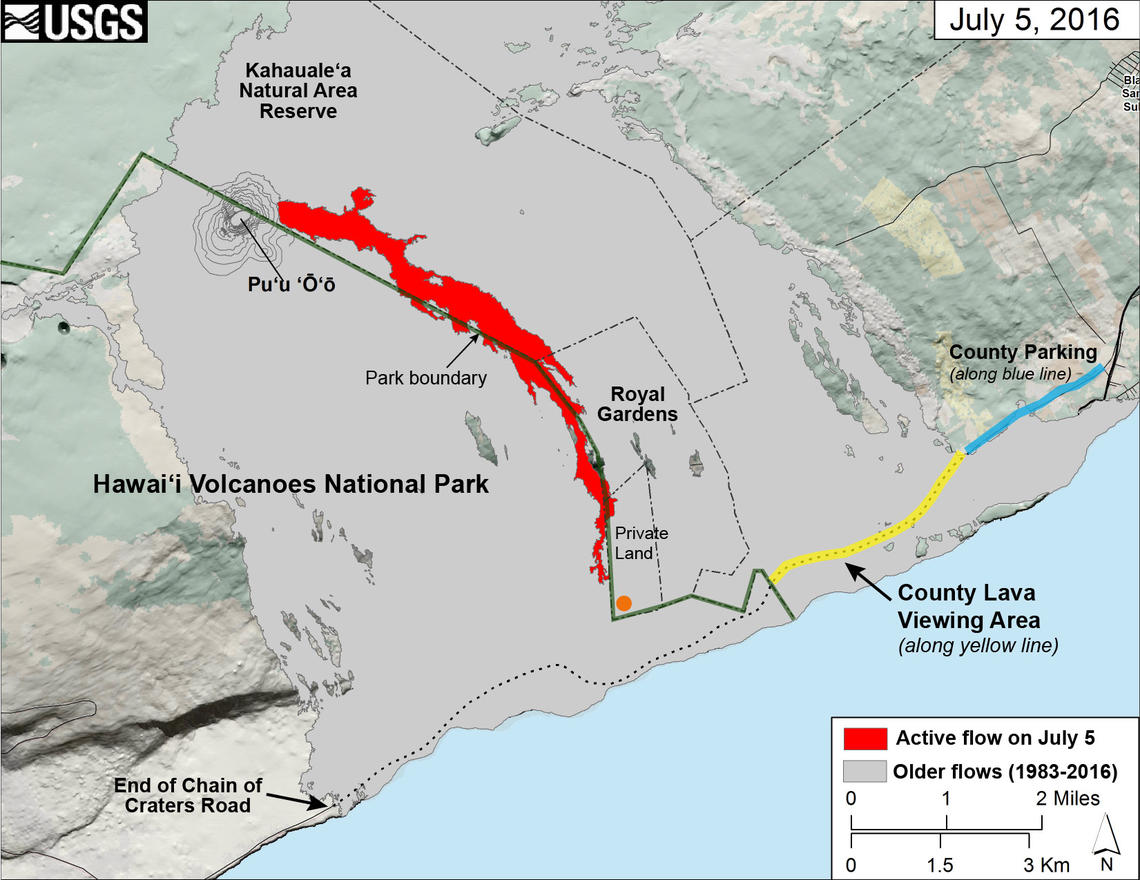
Let's use some downward counterfactual thinking on the 2016 lava flow of Pu‘u ‘Ō‘ō in Hawai'i to appreciate the complexity of predicting the evolution of such an event. Fortunately, this event did not affect any settlements. Here is a summary of the chronology:
| Date | Observation |
|---|---|
| May 24 | Onset of summit eruption at Pu‘u ‘Ō‘ō |
| June 08 | Development of a compound lava flow going SE |
| June 08-28 | Lava flow emplacement as pāhoehoe |
| June 28-30 | Lava reached the pali, transition to 'A'ā |
| June 30 | Onset of development of compound pāhoehoe on coastal plain |
| July 26 | Ocean entry, 11 km away from source |
| Until sept | Widening of the flow field |
Evolution of the flow field
The evolution of the pāhoehoe flow field was studied during the eruption using structure-from-motion from helicopter 9, from which 3D maps of topographic and thermal features were created. These maps capture the spatio-temporal evolution of the dynamics of lava flow emplacement and highlight the difficulty in predicting the ensemble of controlling processes.
Figure 7 illustrates how compound pāhoehoe lava flows alter the topography, which affects the emplacement of subsequent flow units.
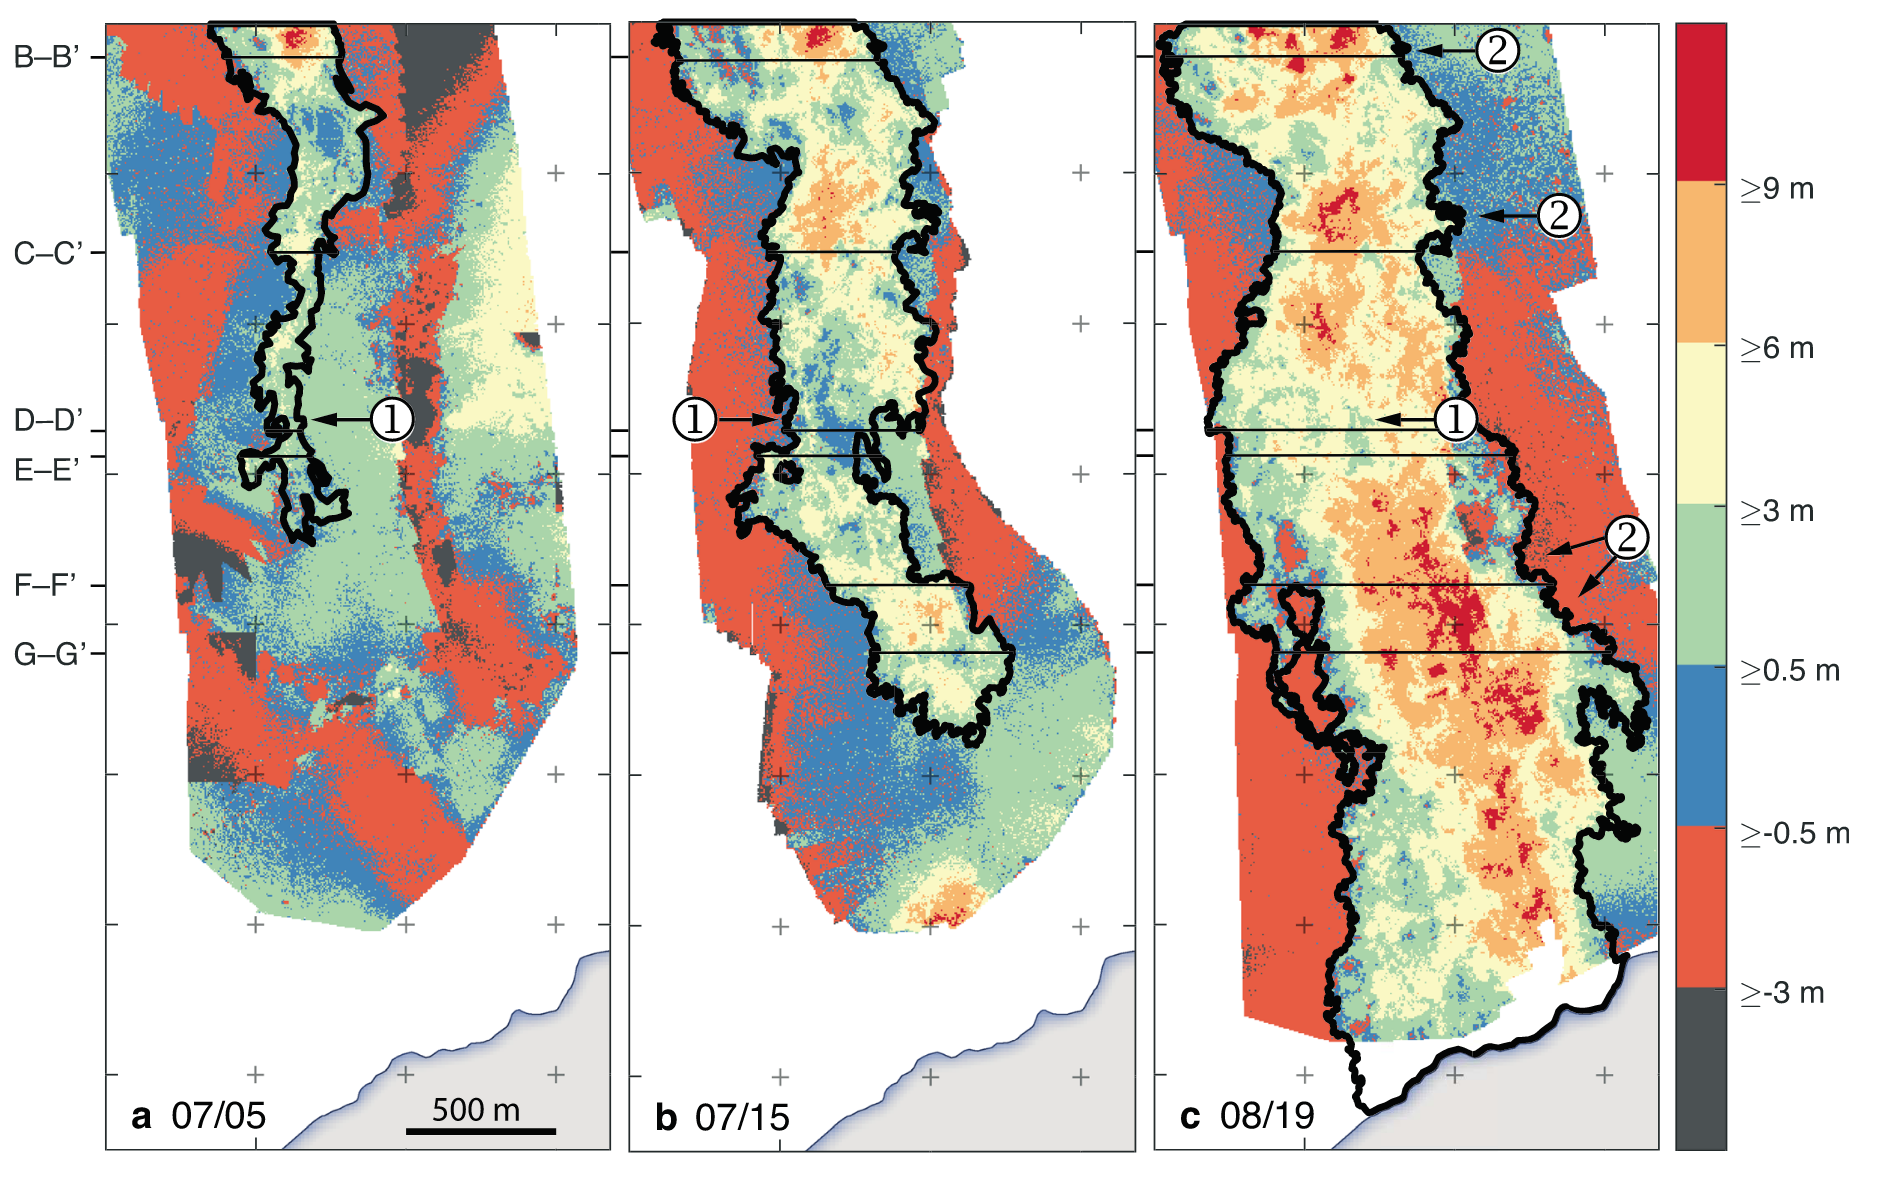
Figure 8 shows the thermal evolution of the surface of compound pāhoehoe lava flows. The initial, uniformly high surface temperature gradually decreases, which reflects the thermal insulation of the flow and the development of lava tubes. Lava tubes efficiently transport lava from the source to the front with little cooling, and drives the down-flow surface breakouts observed on 08/19.
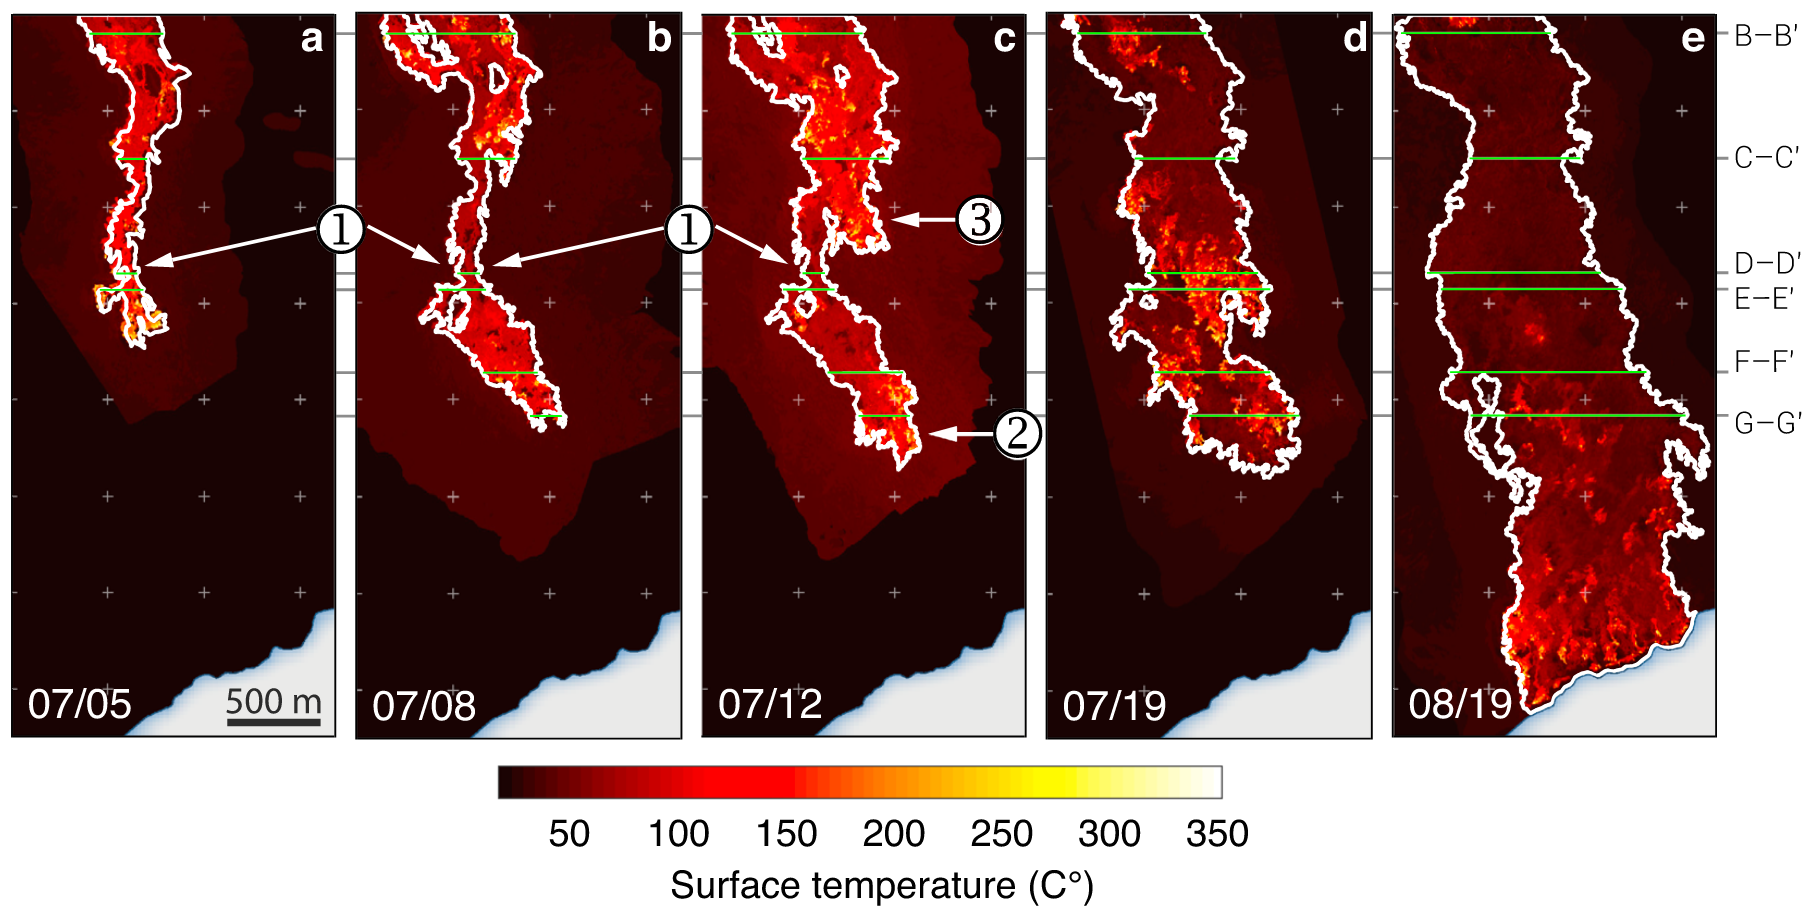
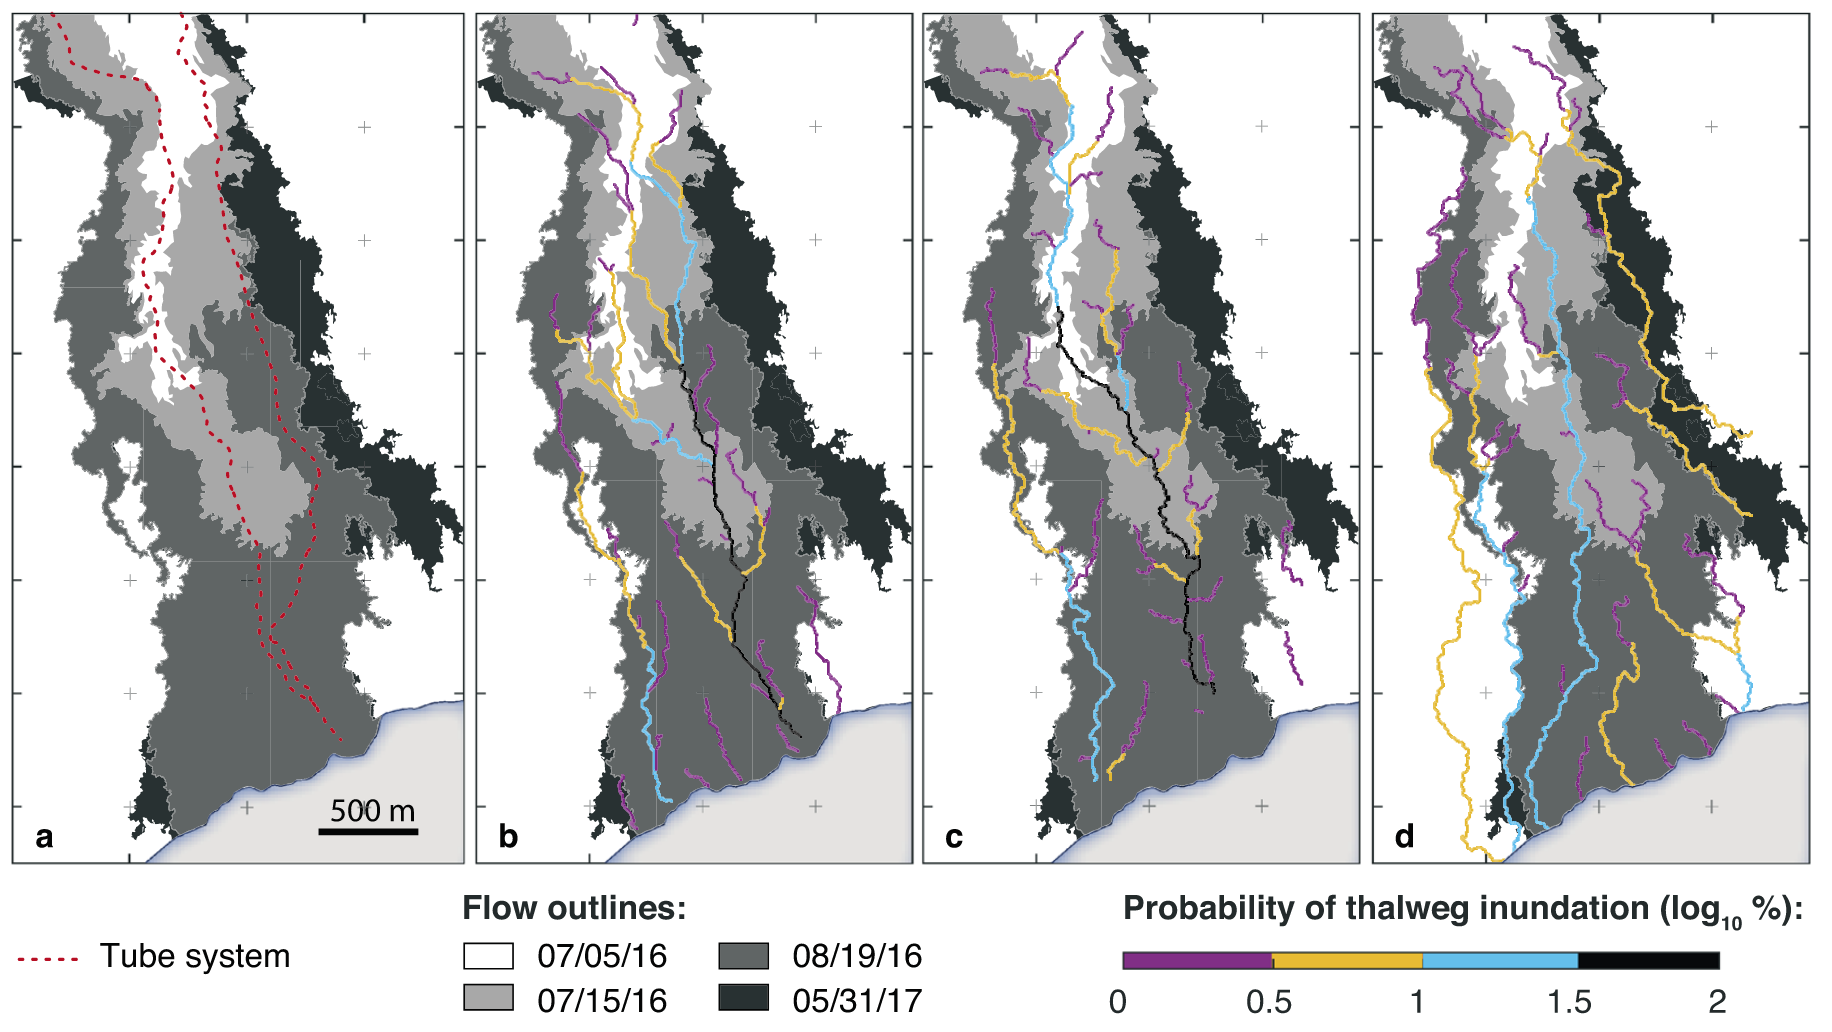
Figure 9 shows the evolution of the prediction efficiency of the path of steepest descent approach as a consequence of the evolution of the DEM and the development of a tube system.
Conclusion
Fundamental processes governing lava flow emplacement are numerous and complicated by feedbacks and non-linear interactions occurring at various temporal and spatial scales. The development of predictive models are impeded by two sources of uncertainties:
- On the one hand, either the full range of parameters to accurately describe emplacement processes are rarely available (e.g., channelised flows) or physical models do not exist (e.g., pāhoehoe flows); this can be referred to as an epistemic uncertainty;
- On the other hand, stochastic rather than physical processes dominate the emplacement dynamics (e.g., pāhoehoe flows); this can be referred to as an aleatoric uncertainty.
This limited ability to predict the evolution of lava flow crises result in high uncertainties during the management of long-lasting lava flow crises. In this context, lava flow hazard assessments should always be achieved with:
- The understanding of the limitations of each models and their sources of uncertainties;
- A framework to quantify and communicate uncertainties, which is out next topic.
Summary
- Lava flows are non-newtonian fluids with a yield strength.
- Their emplacement is controlled by source conditions, topographic control and rheological properties.
- No unified model for flow emplacement exists, and modelling approaches follow two main directions: physical and stochastic strategies.
References
-
Harris, A.J.L., Rowland, S.K., 2015. Lava Flows and Rheology. The Encyclopedia of Volcanoes 321–342. https://doi.org/10.1016/B978-0-12-385938-9.00017-1 ↩↩
-
Kilburn, C.R.J.J., 2015. Lava Flow Hazards and Modeling. The Encyclopedia of Volcanoes 957–969. https://doi.org/10.1016/B978-0-12-385938-9.00055-9 ↩
-
Cashman, K.V., Soule, S.A., Mackey, B.H., Deligne, N.I., Deardorff, N.D., Dietterich, H.R., 2013. How lava flows: New insights from applications of lidar technologies to lava flow studies. Geosphere 9, 1664–1680. ↩
-
Macdonald, G.A., 1953. Pahoehoe, aa, and block lava. American Journal of Science 251, 169–191. https://doi.org/10.2475/ajs.251.3.169 ↩
-
Dietterich, H.R., Lev, E., Chen, J., Richardson, J.A., Cashman, K.V., 2017. Benchmarking computational fluid dynamics models of lava flow simulation for hazard assessment, forecasting, and risk management. Journal of Applied Volcanology 6, 9. https://doi.org/10.1186/s13617-017-0061-x ↩
-
Harris, A.J., Rowland, .S. FLOWGO: a kinematic thermo-rheological model for lava flowing in a channel. Bull Volcanol 63, 20–44 (2001). https://doi.org/10.1007/s004450000120 ↩
-
Mossoux, S., Saey, M., Bartolini, S., Poppe, S., Canters, F., Kervyn, M., 2016. Q-LAVHA: A flexible GIS plugin to simulate lava flows. Computers & Geosciences 97, 98–109. https://doi.org/10.1016/j.cageo.2016.09.003 ↩
-
de’ Michieli Vitturi, M., Tarquini, S., 2018. MrLavaLoba: A new probabilistic model for the simulation of lava flows as a settling process. Journal of Volcanology and Geothermal Research 349, 323–334. https://doi.org/10.1016/j.jvolgeores.2017.11.016 ↩
-
Biass, S., Orr, T.R., Houghton, B.F., Patrick, M.R., James, M.R., Turner, N., 2019. Insights into pāhoehoe lava emplacement using visible and thermal structure-from-motion photogrammetry. Journal of Geophysical Research: Solid Earth 124. https://doi.org/10.1029/2019JB017444 ↩↩↩↩