Gentle introduction to QGIS
Geographic Information Systems – or GIS – are tools designed for capturing, storing, checking, and displaying data related to positions on Earth’s surface - or spatial data. This is a broad topic, too broad to be entirely covered here, and some of you might already be familiar with it. For the others, we will try to keep the information to a minimum required for the exercise. Bear in mind that the main use for GIS here will be restricted to visualisation (rather than analyses) of geospatial data.
For more information, you can visit these links:
GIS are extensively used in the study of natural hazards and their risks as they allow to analyse the spatial relationship between hazardous phenomena and exposed elements. The objectives of this short introduction are to provide you with the basic GIS knowledge necessary to fully understand the volcanic hazard assessment of the following classes. Specifically, the objectives are:
- Getting to know the QGIS interface
- Load data into QGIS
- Creating and saving maps
Some basic GIS concepts
The most common GIS most of us use on a daily basis is OpenStreetMap (OSM for short) or any equivalent. There, a lot of data is stored and georeferenced, meaning that all piece of data has a geospatial reference and is able to be located on the globe's surface. In GIS, datasets are stored in two main forms: vector and raster. Think of it as the same fundamental difference that exists between Illustrator and Photoshop.
Vector data
OSM contains only vector data, which can be either points, lines (e.g., roads) or polygons (e.g., lakes). For points, a vector GIS data showing some information about some of my favourite Swiss mountains could look like this:
| Latitude | Longitude | Name | Altitude | Canton | First ascent |
|---|---|---|---|---|---|
| 45.976 | 7.658 | Matterhorn | 4,478 m | Valais | 1865 |
| 46.034 | 7.612 | Dent Blanche | 4,357 m | Valais | 1862 |
In this case, the Latitude and Longitude columns hold geographical data, whereas the other columns hold non-geographical attributes. More information is available on the Wikipedia and QGIS websites.
Coordinate systems
In the example above, we used Latitude and Longitude to express the y and x coordinates of the points. This seems trivial, but actually opens a complex problem which is how to represent a distorted spherical body onto a flat map. This has been a problem since about 650 BCE, and a lot of different projections have been proposed, each with benefits and negative aspects. In any case, in the classes we might refer to either coordinate systems or EPSG (an international code referencing the various projections). More information is available here.
Raster data
Raster data are stored as a grid of values - or pixels. There is no raster data on OSM, but two common raster datasets are satellite imagery or digital elevation models (or DEM). The main difference with vector datasets is that if you zoom sufficiently, pixels will start to appear. The zoom level at which this effect occurs depends on the raster's resolution, i.e., the size of a given pixel in the x and y directions. More information is available on the QGIS website.
QGIS
Quantum GIS – or QGIS – is an open-source GIS software. We use it as it is free, cross-platform and powerful. A comprehensive documentation on QGIS (and GIS in general) is available on the QGIS website.
The QGIS interface
The QGIS interface is shown in Figure 1. Note that the Graphical User Interface (GUI) is highly customisable and might look different at first, but the red numbers indicate the main common components.
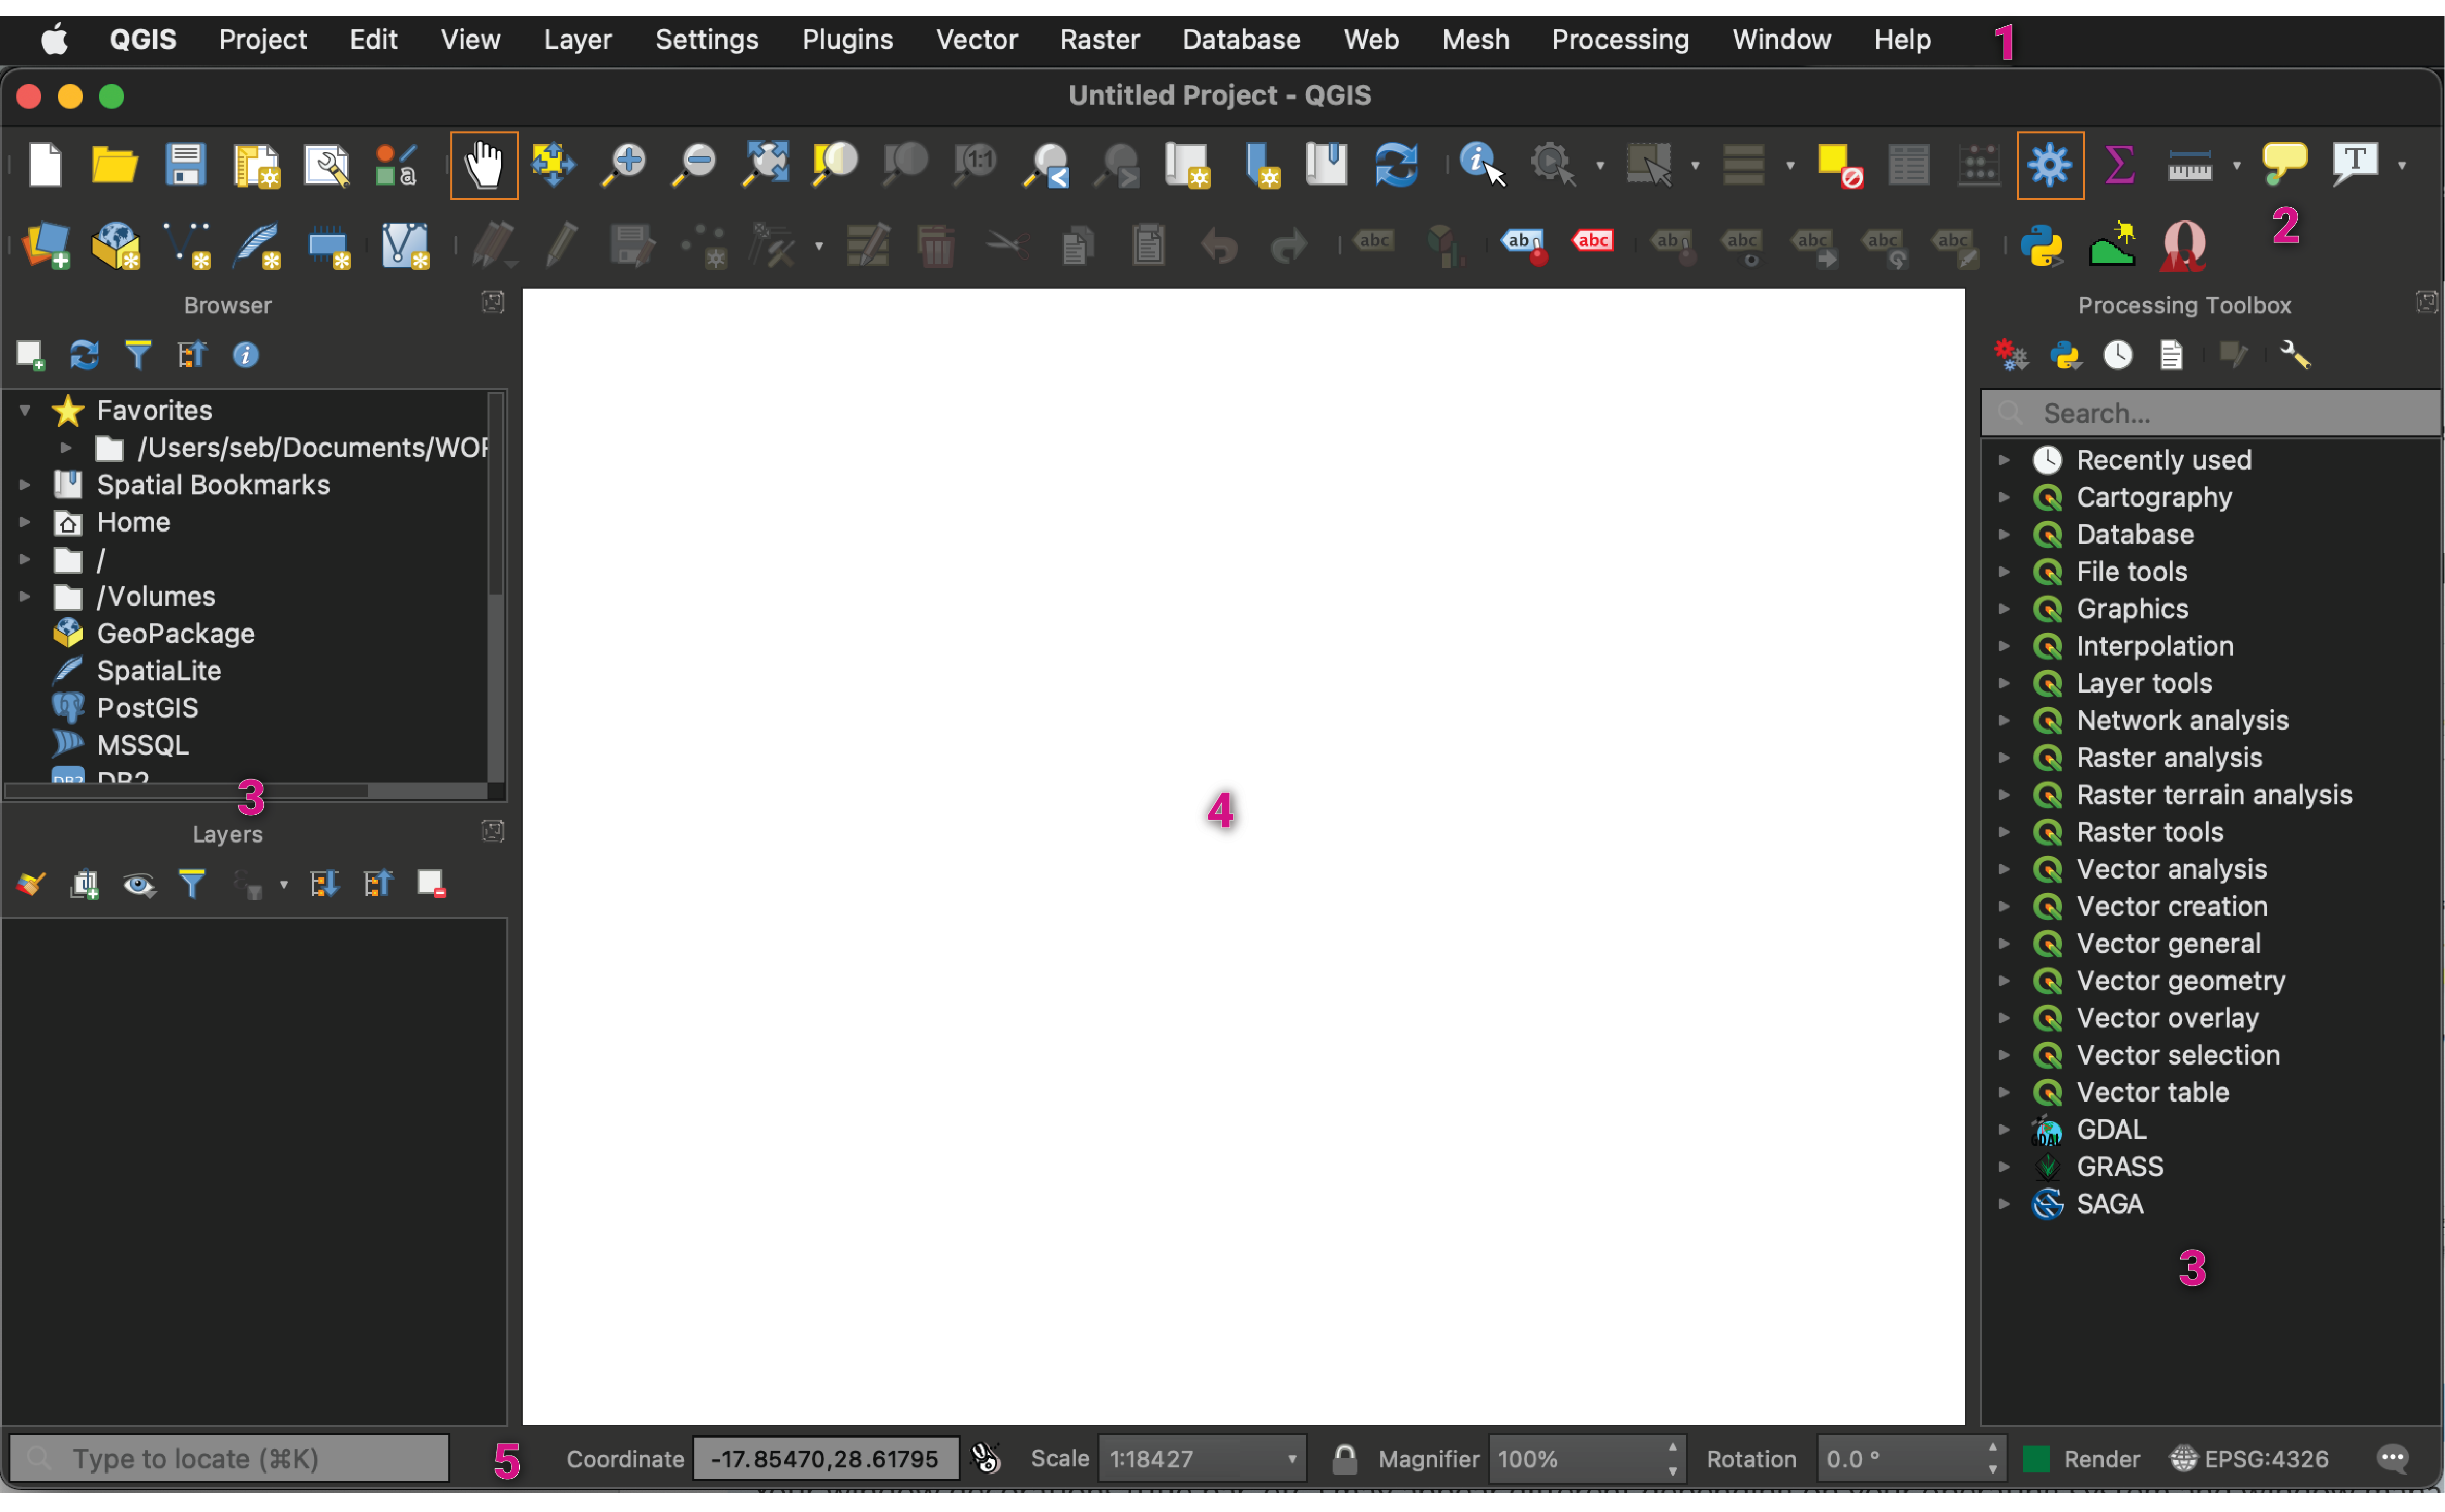
The main component of the interface are:
Let's focus on specific aspects of the GUI.
Panels
Panels are special widgets that you can interact with, and QGIS provides multiple panels for various tasks. Here, let's focus on the Layer panel.